Week 4
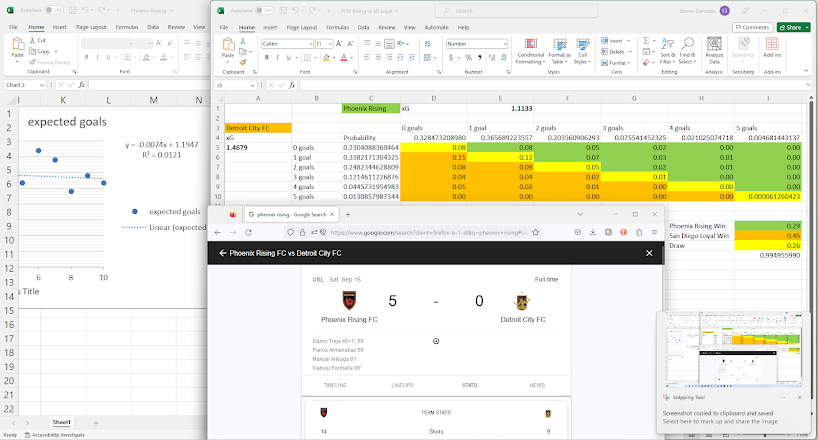
This past week, Dr. Posta tasked me with again building a simple model to predict an upcoming match between the Phoenix Rising and Detroit City FC. For this week, there was a focus on using Excel formulas while building this model. Once again, using stats from the past 10 games, I calculated expected goals for both teams heading into this match. Using that xG stat, I calculated the probabilities of several different possible outcomes of the game.
Ultimately, the model expected the Phoenix Rising to win 29% of the time, lose 26% of the time, and draw the remaining 46 percent of the time, with the single most probable outcome being a 1-1 draw 12% of the time.
The actual outcome of the match was a 5-0 blowout by the Phoenix Rising. The model only expects a 5-0 outcome 0.00006 percent of the time, so the result of this match was very much a statistical anomaly. This is what brings us to the next stage of our research project, data collection.
For this project, we are going to be collecting a lot of data. While it will be a long process, it is very much necessary to drown out the “noise” from statistical outliers, such as this most recent Phoenix Rising match, that would otherwise skew our predictions. This week, I will be meeting not only with Dr. Posta, but the rest of the team working on this project. So I am excited to get to meet the rest of the team and continue making progress on our project.


Hi Steven,
ReplyDeleteIt's really interesting what your model expected versus the actual outcome. I don't watch a lot of soccer but I imagine 5-0 outcome is pretty big no matter what. I find collecting data to be one of easier task to do in science. I hope that you get all the data you need with the best outcomes.